This geospatial analysis project analyzed the current layout of the public transportation system in Chattanooga, Tennessee to identify the areas with high populations of people without reliable access to cars in which an extension of the bus line is needed.
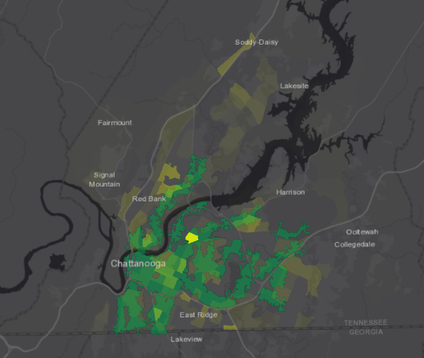
The map shows the bus stop routes with a buffer around the bus lines to represent the walkable distances from each stop in green. The yellow overlay represents the census blocks mapped according to the density of people without access to a car. By overlaying those layers, it’s easier to see which areas of the city with high proportions of people without cars, who presumably rely on public transportation, do not have adequate bus routes.
While much of the census blocks with low access to cars is covered by the bus service areas, there are still a few cities that are considerably outside the service areas, like Soddy-Daisy, Lakesite, Red Bank, and East Ridge. These would be good locations to build route extensions and add stops to increase the percent of the population with inconsistent access to cars that is served by Chattanooga's bus lines.